The Rendering–Surface Gap in Gaussian Splatting
A controlled DTU Scan 24 study showing that high-fidelity novel-view rendering and accurate extracted geometry are related but distinct objectives. The artifact compares published PGSR, MILo, and TSGS baselines with project diagnostics that were accepted only when both image and surface criteria improved.

What this project established
Analytical framing
Let θ denote the parameters of a Gaussian scene, R(θ, c) its rendered image from camera c, and E(θ) the surface produced by a chosen extraction operator. Training primarily minimizes an image-space objective, while evaluation of geometry acts on a different object produced after extraction.
Low image loss therefore does not imply low surface error: the renderer integrates color, opacity, covariance, and visibility, while extraction applies a non-equivalent depth or density rule. A candidate perturbation is retained only when it crosses a geometry threshold without violating held-out image tolerances.
Reporting both directional distances matters. The TSGS first-surface diagnostic lowers surface-to-data distance but raises data-to-surface distance; its average improves even though the reconstruction becomes less complete in one direction.
Third-party method control runs
| Method | PSNR ↑ | SSIM ↑ | LPIPS ↓ | FG PSNR ↑ | Chamfer ↓ |
|---|---|---|---|---|---|
| PGSR | 20.258 | 0.7210 | 0.2372 | 21.620 | 3.287 mm |
| MILo | 20.565 | 0.7383 | 0.2158 | 20.787 | 2.431 mm |
| TSGS | 23.480 | 0.9149 | 0.0987 | 27.574 | 2.752 mm |
All image metrics use the same seven held-out views. Results are limited to DTU Scan 24.
Controlled project diagnostics
| Diagnostic | Parent | PSNR Δ | Chamfer | Relative change | Decision |
|---|---|---|---|---|---|
| RayOT | PGSR | −0.186 dB | 3.111 mm | +5.36% | Reject: image |
| GaugeSplat | PGSR | −0.001 dB | 3.281 mm | +0.17% | Reject: geometry |
| TraceSplat | MILo | −0.019 dB | 2.426 mm | +0.19% | Reject: geometry |
| TSGS first surface | TSGS | unchanged | 2.646 mm | +3.86% | Post-hoc diagnostic |
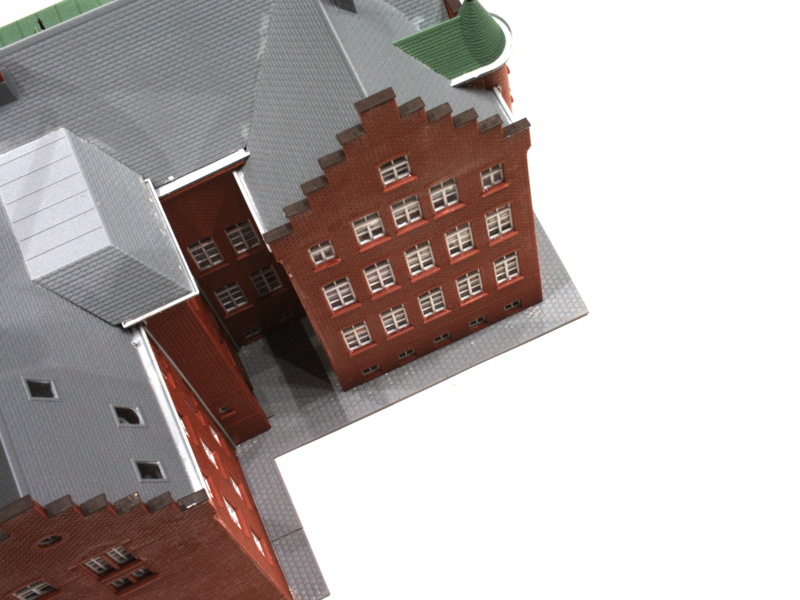
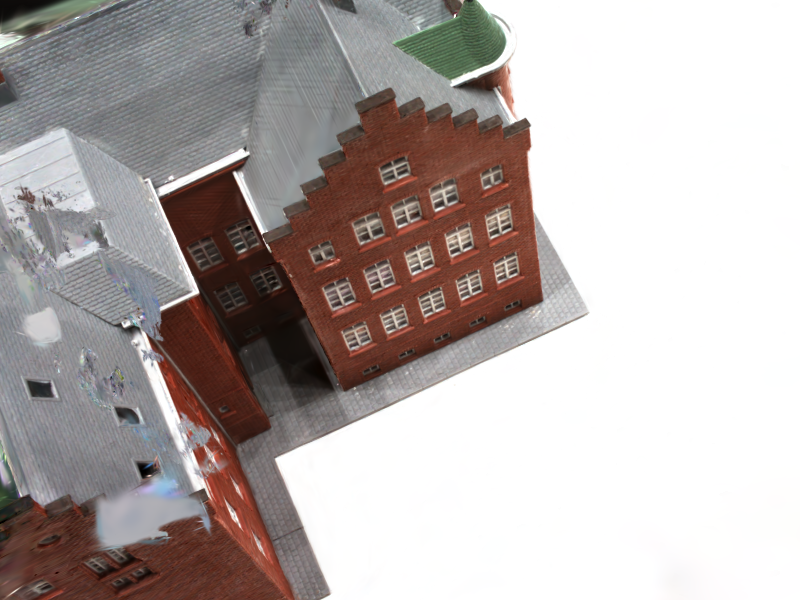
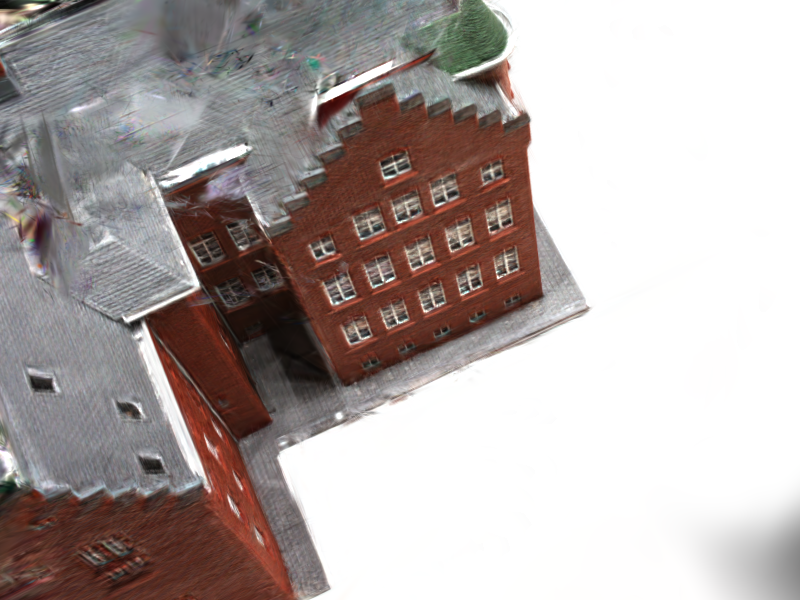
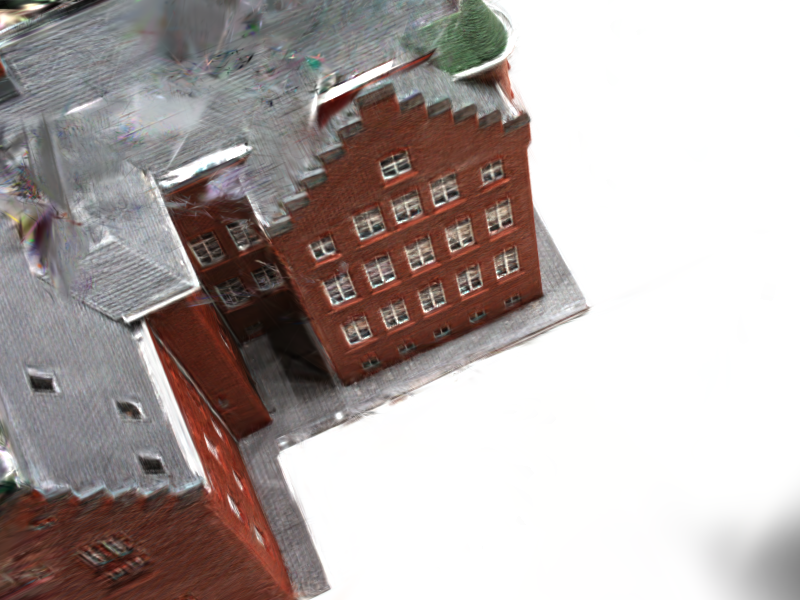
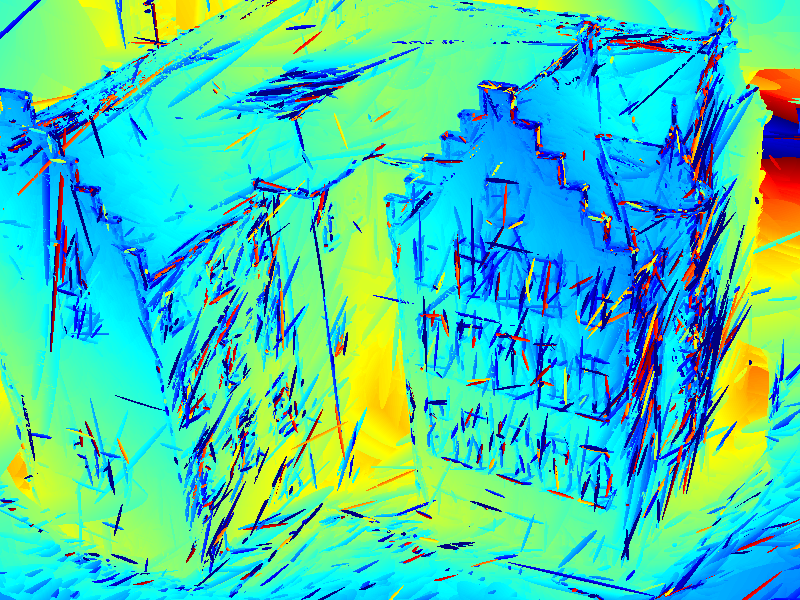
Representative held-out renders
Reproducibility and limitations
Included
- Exact JSON metric snapshot used by the report
- Deterministic CSV and Markdown table generator
- Numerical validation and unit tests
- Seven-page PDF and LaTeX source archive
- Representative renders and comparisons
Not claimed
- No DTU-wide or state-of-the-art superiority
- No ownership of PGSR, MILo, or TSGS
- No unified redistribution of third-party training code or weights
- No conclusion beyond the single audited scan
- No positive method claim for rejected diagnostics